Data & Dashboards
All your key metrics—live and trustworthy. Connect data sources, build charts, and get AI insights without the complexity.
Turn data into decisions
Connect, visualize, and understand your data without a dedicated analyst.
No-code connections
Bring in CSVs, databases, and third-party metrics without writing queries.
Live charts & tables
Build beautiful visualizations in minutes with smart formatting.
AI insights
Summarize trends, flag anomalies, and get suggested next steps.
Smart alerting
Get notified in channels or via email when metrics hit thresholds.
Connect everything
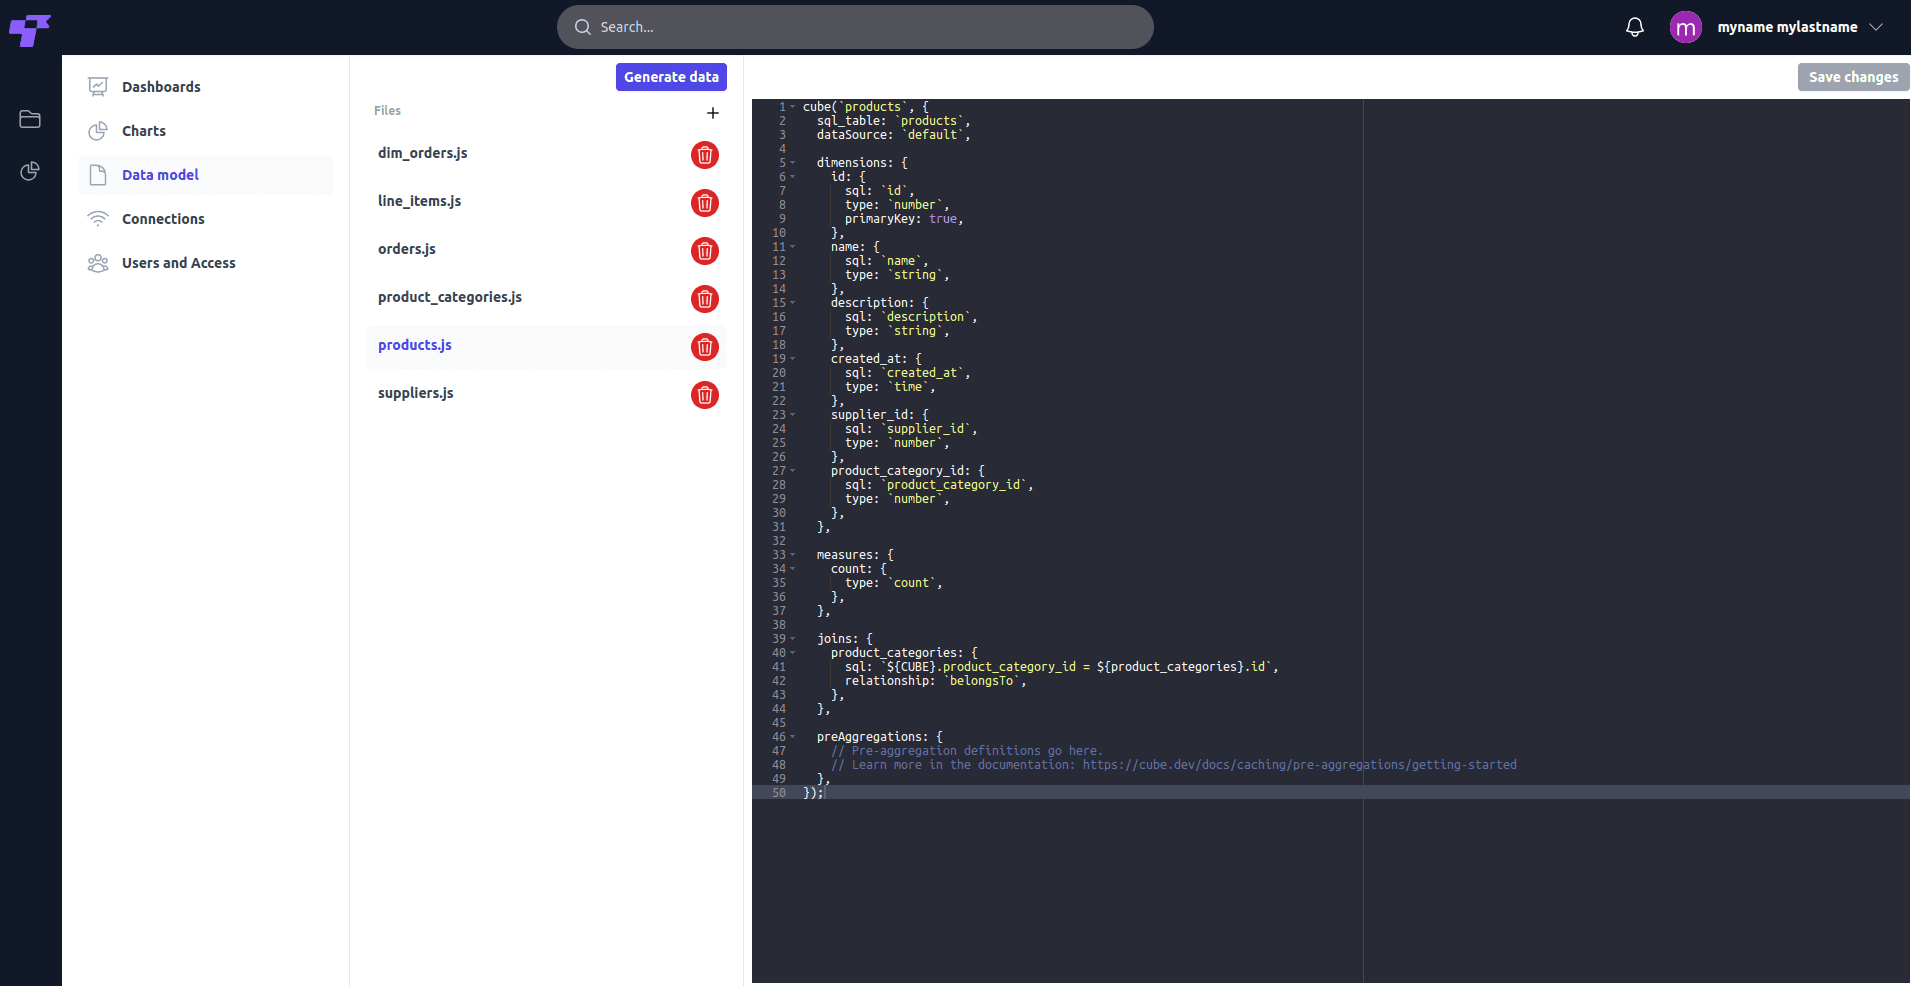
Import data from spreadsheets, databases, APIs, and popular business tools. Schedule automatic refreshes to keep dashboards current.


AI-powered insights
Don't just look at charts—understand what they mean. Get automated summaries of key changes and suggested actions.
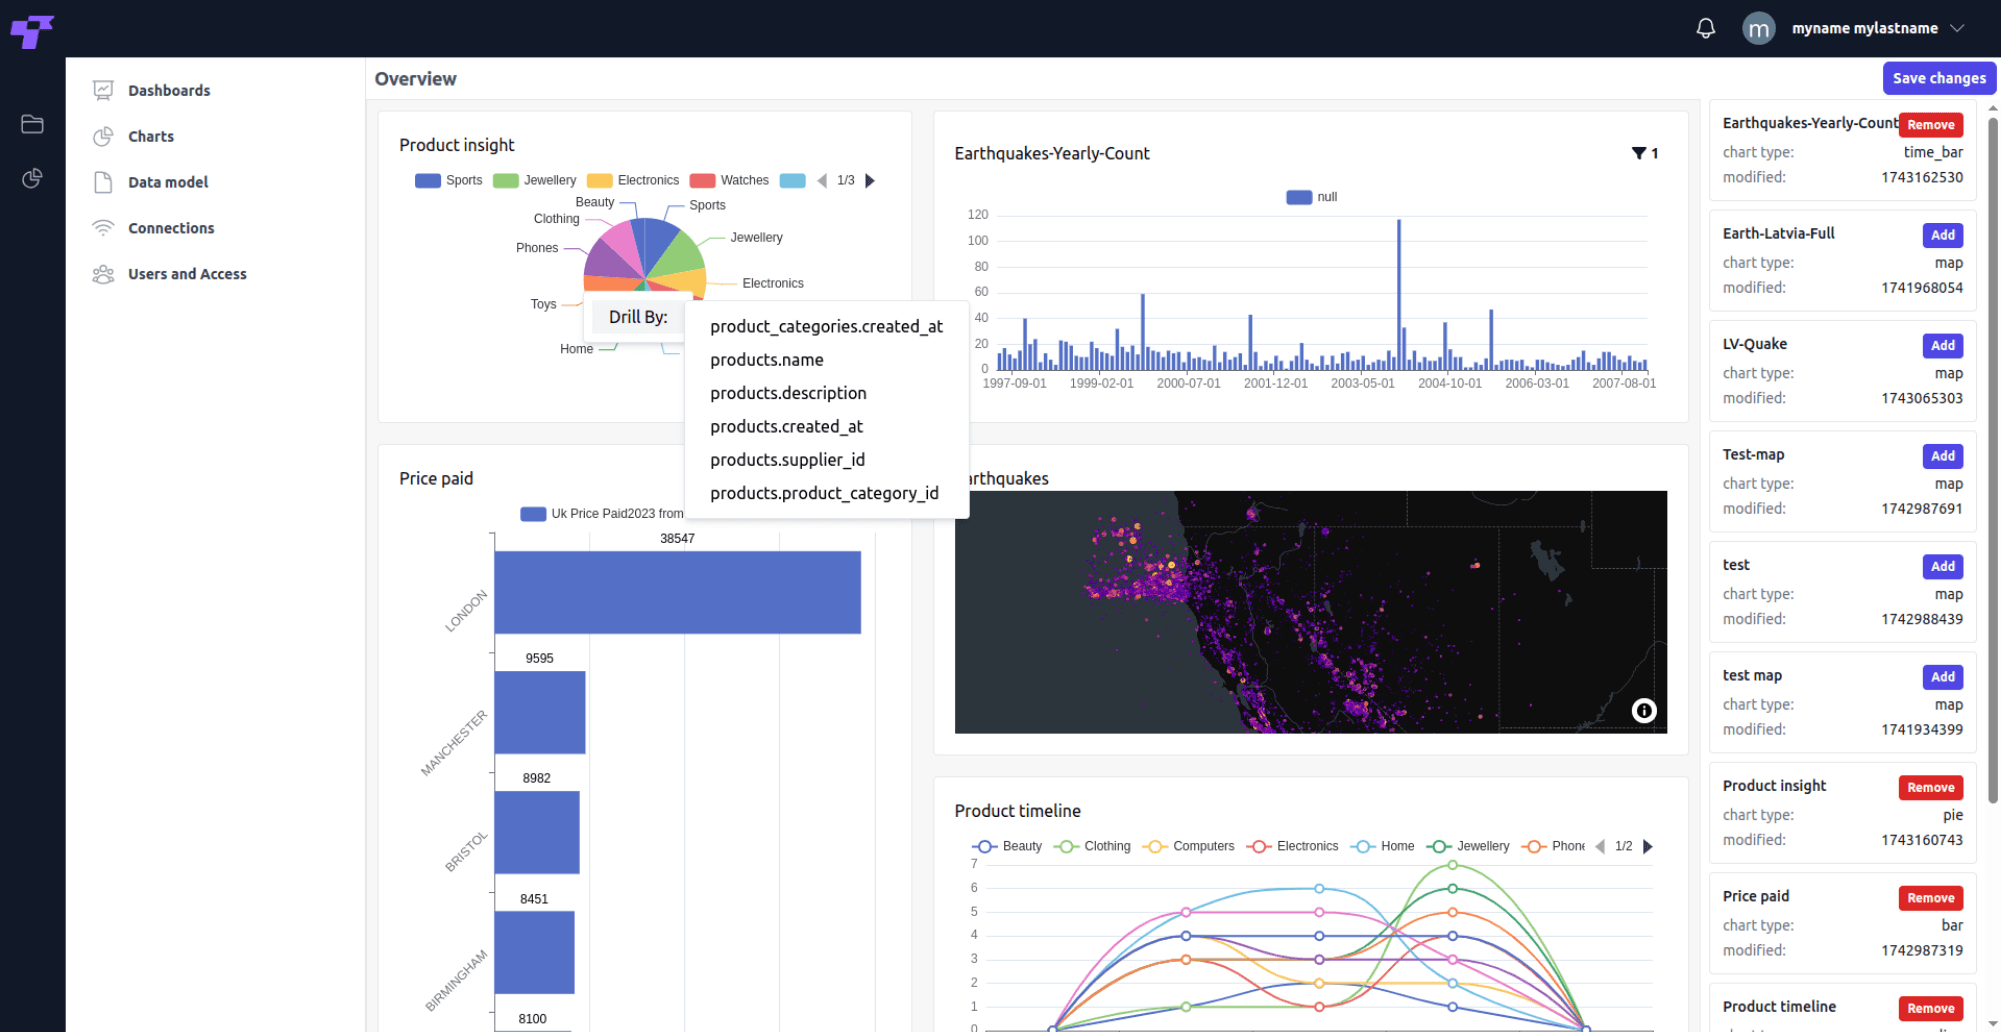
Every chart type you need
From simple bar charts to complex multi-axis visualizations.
Standard charts
Bar, line, pie, scatter plots with automatic formatting and colors.
Interactive tables
Sortable, filterable data tables with conditional formatting.
KPI metrics
Single-number metrics with trend indicators and progress bars.
Data that drives action
Your dashboards aren't isolated—they're connected to your team's workflow.
Team notifications
Post dashboard updates to team channels automatically when key metrics change.
Discussion context
Link charts to conversations and decisions for full context on data changes.
Ready to see your data clearly?
Stop squinting at spreadsheets. Build dashboards that actually help you make decisions.